

Financial Module
Use your data to lower your costs and raise your margin.
Through the PDS API, your cultivation data works alongside your accounting system. The Financial module shows what every part of your grow costs, from labor to nutrients, down to the pound. It also shows which strains drive your revenue, so you can see where to cut and what to grow more of.
With cultivation and financial data in one place, what were once difficult decisions are made quickly and confidently: what to grow, which costs to cut, what processes need optimization, and how to plan for the next cycle.
QuickBooks Online, or an uploaded QuickBooks P&L. 21 closed months, Jan 25 to Sep 26.
- Labor 57.4%
- Facility overhead 21.9%
- Electricity 10.4%
- Five more 10.3%
Each month’s dollars over that month’s pounds. 32 finished harvests, finished flower only.
Of each $1.00 of price, 0.46 covers cost of production and 0.54 is cultivation profit.
Summary
Booked price, cost/profit per pound, and gross margin displayed together.
- Revenue against cost of production by month.
- Cost of production by category.
- Top strains by revenue.
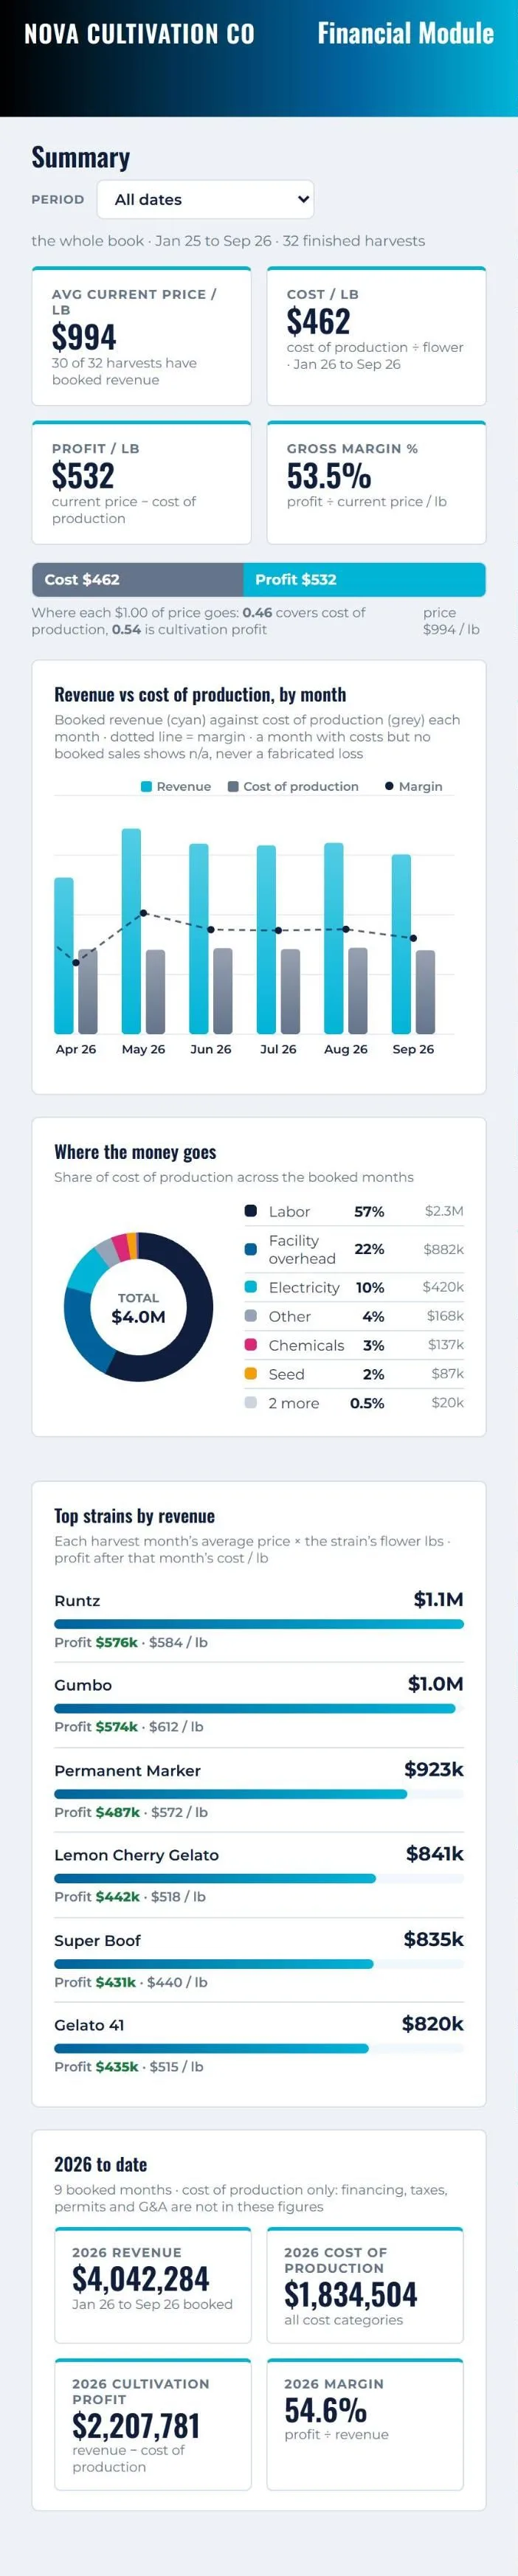
Booked price, cost and profit per pound, and gross margin.
P&L
PDS imports your monthly P&L from QuickBooks Online or a QuickBooks Excel export. Each account is mapped to a cost category, such as labor or nutrients.
- QuickBooks Online imports twelve complete months, then refreshes the latest complete month each night.
- Cost mix by month for every category.
- Cost of production by category, with its share and cost per pound.

Revenue against cost of production, every month on the books.
Unit Economics
PDS divides each month’s revenue and cost by the finished product harvested that month.
- Price and cost per pound by month.
- Revenue per square foot and per light, per year.
- Value, cost and margin of the last harvest.
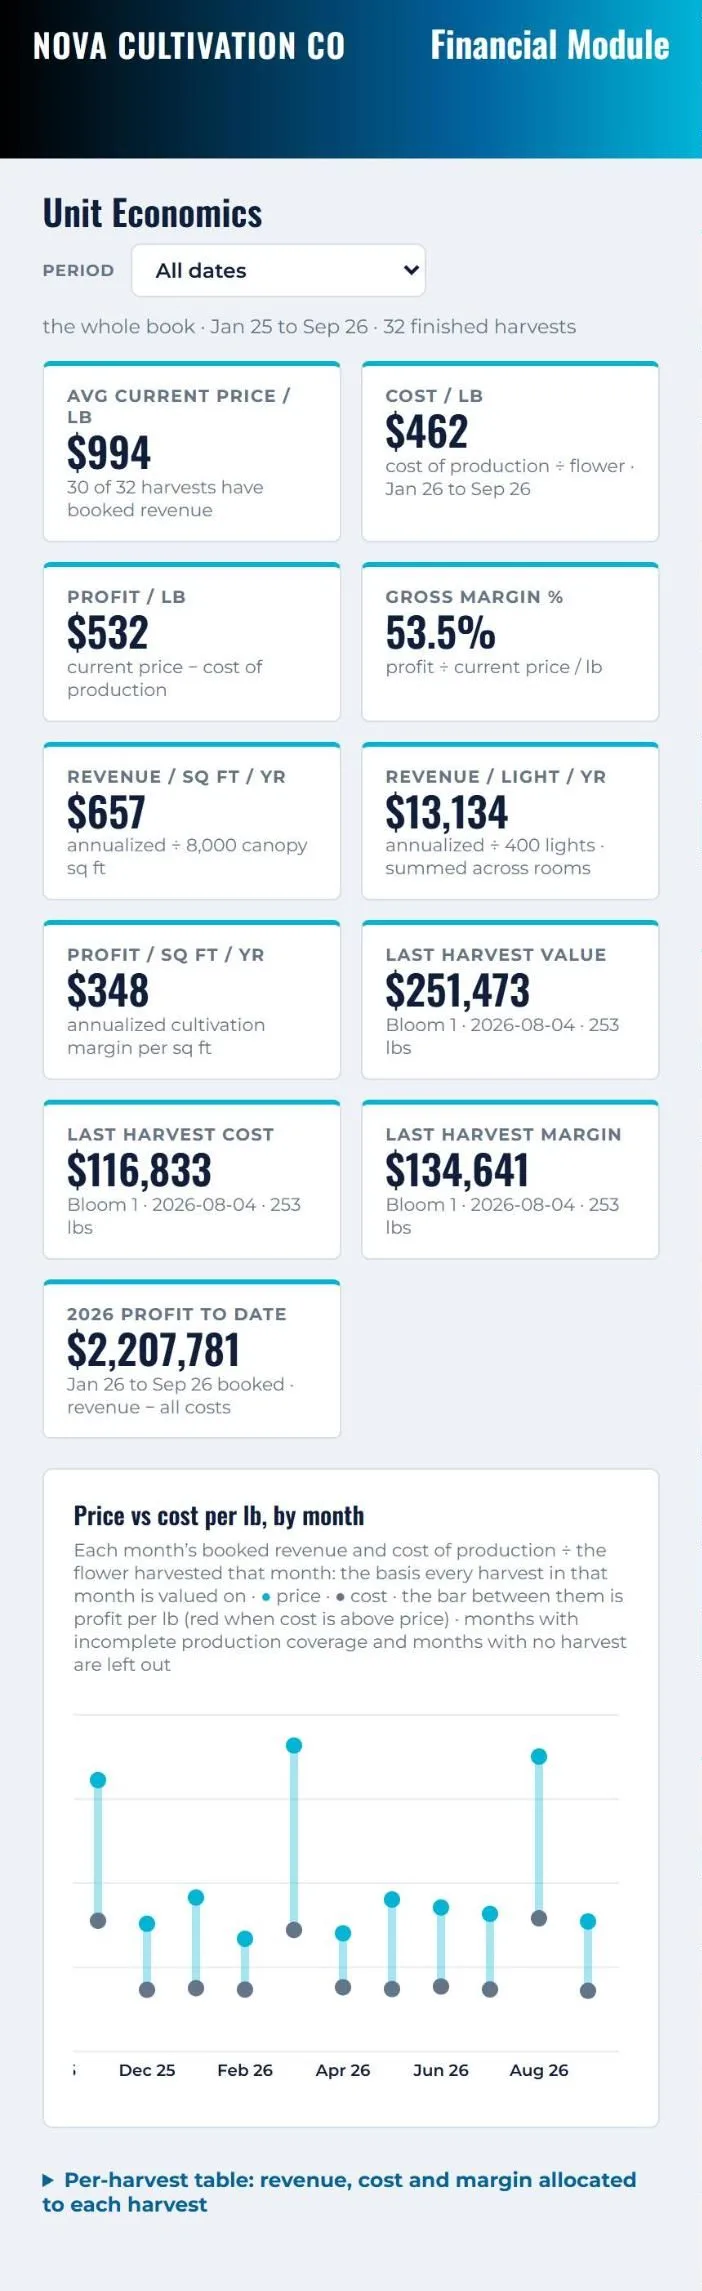
Price, cost and profit per pound, and gross margin.
Revenue
Every strain ranked by revenue, priced at that month’s average price per pound.
- Revenue, profit and price per pound for each strain.
- Profit after that month’s cost per pound.
- The top 12 strains as bars, the rest one click away.
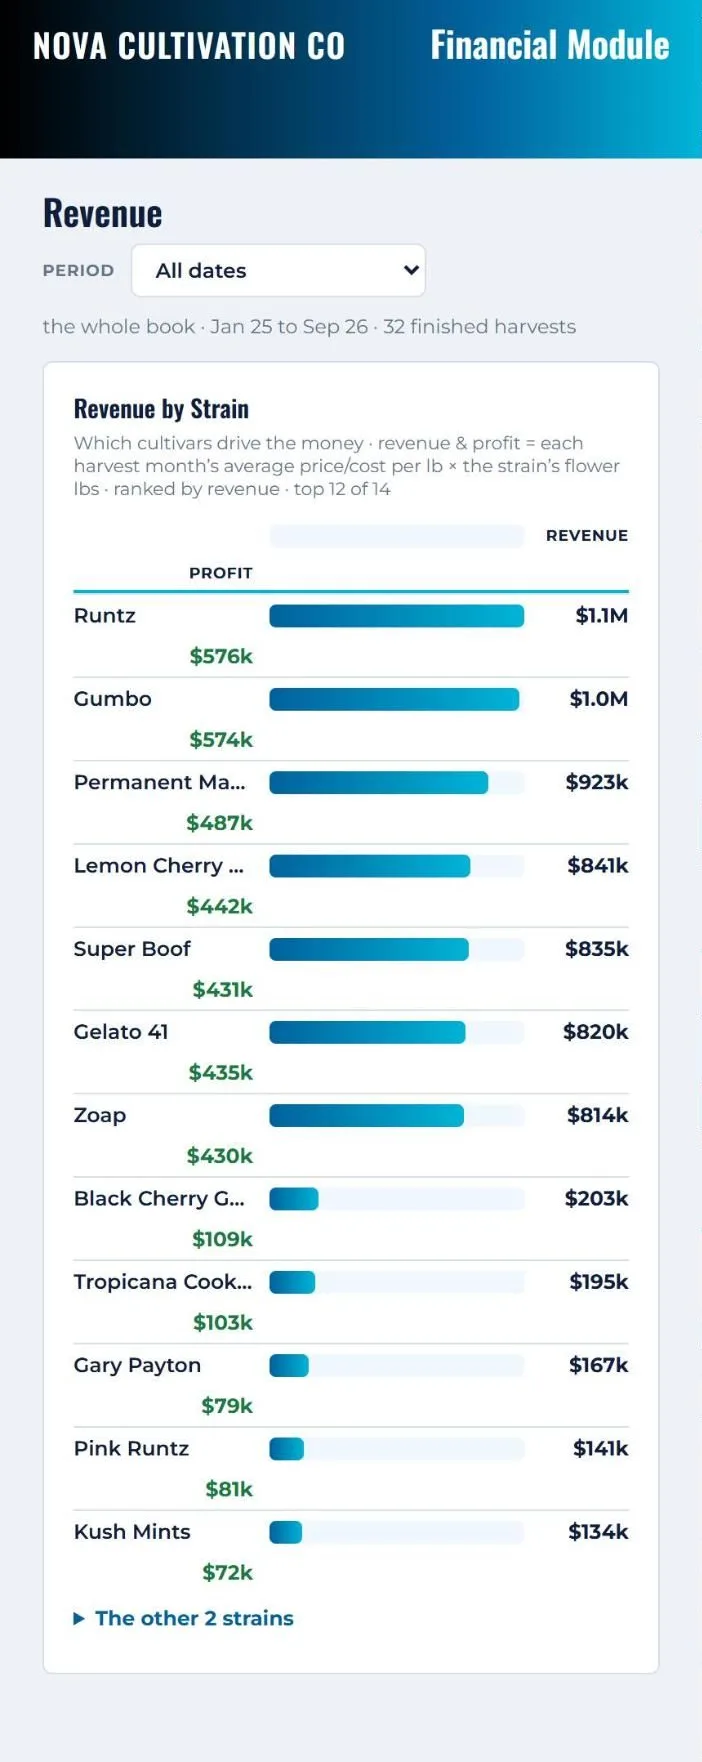
Each strain’s pounds priced at its harvest month’s average price.
Harvest P&L
Revenue, cost and margin for every finished harvest, allocated from the month’s books by what each harvest produced.
- Revenue, cost and margin harvest over harvest.
- Every finished harvest in one sortable table.
- Each harvest broken down by strain.

Harvests valued, the average margin, and the best and latest harvest per pound.
Strain Performance
Up to four strains side by side, run by run, across all of your finished harvests.
- A leaderboard by pounds per light, grams per plant, grams per square foot or total pounds.
- Each strain’s tier and run-to-run consistency.
- A strain by room grid of yield.

Rank by pounds per light, grams per plant, grams per square foot or total pounds.
Outlook
The rest of the year projected from your booked months, your 12-month run rate, and the price you need to break even. Planning ranges, not forecasts.
- Linear and compound growth projections for the year.
- Revenue, cost and margin at your 12-month run rate.
- Revenue and margin from 70% to 130% of today’s price, with break-even per pound.
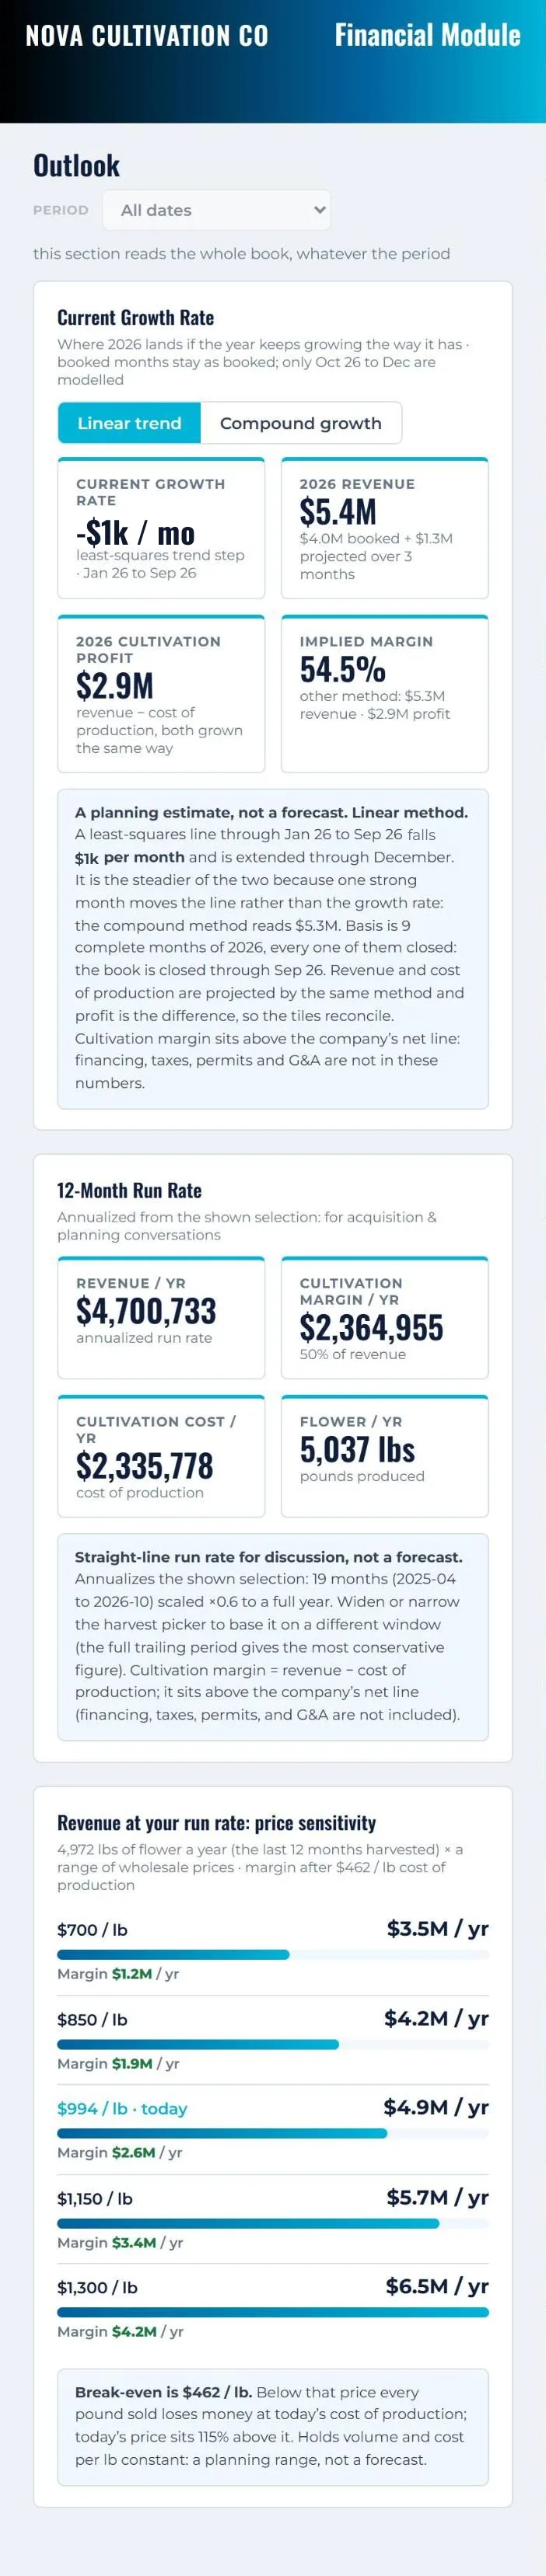
The rest of the year projected two ways, linear and compound.