

Controlled Environment Agriculture Isn’t Vertical Farming. It’s Control Over What Decides Yield.
What is CEA? Controlled environment agriculture (CEA) is crop production in an enclosed structure that gives the grower complete or partial control of growing conditions. Is it the same as vertical farming? No. Vertical farms are one small corner of it: roughly 500,000 hectares of greenhouses operate worldwide outside China, against about 30 hectares of vertical farms. Why does it matter? Control raises yield per square meter and cuts water per kilogram. It only pays when the grower acts on what the controls are doing.
PDS layers on top of the climate controls you already run, so you can see what your rooms did, not only what they were set to do.
Show me how PDS tracks thisCEA allows for more control over the growth environment, often resulting in higher yields and better product quality.
Often. Not always. The whole category lives inside that word, and the operators who understand it are the ones still growing.
What controlled environment agriculture is
USDA’s Economic Research Service describes CEA as crop production “in greenhouses or other structures that use horticultural and engineering techniques beyond conventional soil-based outdoor production,” and notes it also goes by protected agriculture or protected culture. Ohio State’s extension definition is the cleanest one an operator can use:
Ohio State University Extension defines controlled environment agriculture as crop production “conducted in an enclosed structure that allows for complete or partial control of growing conditions.” (HYG-5819, 2025)
Not every institution draws the line in the same place. Cornell describes CEA as “an advanced and intensive form of hydroponically-based agriculture.” Ohio State includes soil-based high tunnels and mushroom production. USDA’s crop insurance program requires a fully enclosed structure for the whole crop year, which leaves seasonal high tunnels out. The definitions disagree about structures and growing methods. Every one of them agrees on control.
The idea is old. Roman writers describe movable beds glazed with transparent stone for Emperor Tiberius, and the crop, long translated as cucumber, was a snake melon (Janick and Paris 2022). The term itself came into use in the 1960s around University of Arizona desert greenhouse research (Virginia Tech Extension), and NASA’s space-farming research, begun around 1980, is credited with the first use of LEDs to grow crops (Wheeler 2017).
Controlled environment agriculture vs vertical farming
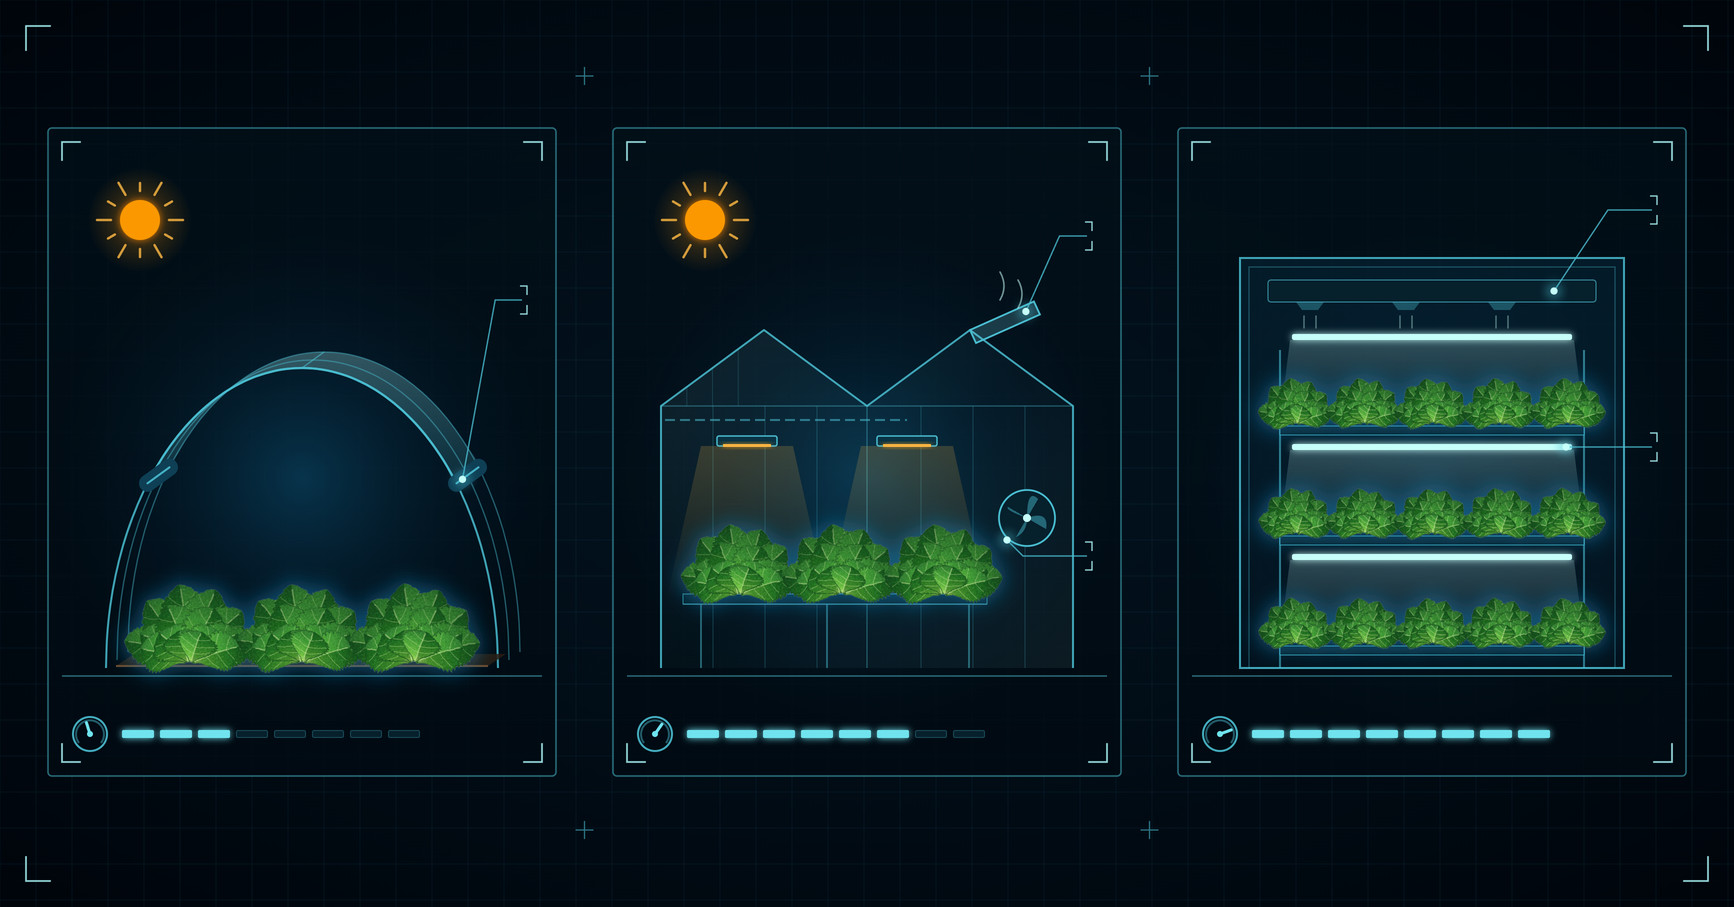
CEA is a spectrum. The structures differ in how much of the environment they hand to the grower, and the clearest way to see it is to ask how each one cools.
- High tunnelsUnheated plastic structures that give some climate protection without the controls of a greenhouse. Cooling means rolling up the sides.
- GreenhousesGlass or plastic, cooled with vents, shade, exhaust fans and evaporative pads, often with heating, supplemental light and CO2. This is where most of the world’s CEA happens.
- Vertical farms and plant factoriesInsulated, airtight rooms with stacked growing tiers, every photon supplied by lamps, and the climate run by building HVAC.
- Mushroom housesIndoor rooms, not greenhouses, which is why federal statistics count mushrooms separately from other protected food crops.
Controlled environment agriculture is the umbrella, and vertical farming is one corner of it. CEA describes the enclosure and how much of the environment it controls. Hydroponics, aquaponics and substrate culture describe the root zone inside it, and soil-based CEA exists: a greenhouse growing in soil is CEA, and a hydroponic system in an open field is not. Scale settles the rest. Greenhouses cover roughly 500,000 hectares worldwide outside China, against about 30 hectares of vertical farms (Stanghellini and Katzin 2024). The researchers who assembled those numbers are blunt about the comparison that matters: “the proper benchmark for evaluating VF should be high-tech greenhouses,” not open fields. The vertical farming bankruptcies were a verdict on one corner of the spectrum, in large part on its energy bill. They were not a verdict on CEA.
Why is controlled environment agriculture important?
The case for CEA is strongest where field production is weakest, and it holds up best when stated with its conditions attached.
- Yield per square meterDutch high-tech greenhouses produce about 34 kg of lettuce per square meter per year without supplemental light and about 65 kg with it (Pennisi et al. 2025). US field head lettuce averaged about 3.8 kg per square meter per crop in 2022 (USDA NASS, converted from yield per acre). Field land can carry more than one crop a year, so the gap is smaller than the raw ratio, but it is still large.
- Water per kilogramPooled lettuce data put the median open-field crop at about 104 liters per kilogram, against about 15 in high-tech greenhouses and about 16.5 in vertical farms (Pennisi et al. 2025). That is roughly 85 to 90 percent less water per kilogram in recirculating systems. The “95 percent less” figure that circulates is a best case, and greenhouses capture most of the saving without stacking a single tier.
- Predictable supplyField lettuce supply in 2022 was “affected by weather, water allocation challenges, and the Impatiens Necrotic Spot Virus” (USDA NASS). Protected production smooths that, though not perfectly: Dutch greenhouse lettuce yields in December still run about 55 percent of May’s, even with lights (Pennisi et al. 2025).
- A different food safety exposureBetween 2009 and 2018, 40 outbreaks of Shiga toxin-producing Escherichia coli were linked to leafy greens in the US and Canada, with 1,212 illnesses, 420 hospitalizations and 8 deaths, and suspected sources included nearby cattle operations and irrigation canal water (Marshall et al. 2020). Enclosure removes some of those routes. It does not remove all of them: a 2021 Salmonella outbreak that sickened 31 people in four states traced to a hydroponic greenhouse, and indoor systems have had recalls of their own (Topalcengiz et al. 2024).
Where CEA loses
Any honest account of controlled environment agriculture has to include the ledger’s other side.
Carbon. Pooled life-cycle studies of lettuce put the median footprint at about 0.13 kg of CO2 equivalent per kilogram in open fields, 1.98 in high-tech greenhouses and 0.82 in vertical farms, with vertical farms ranging from 0.06 on wind power to 22 on coal (Pennisi et al. 2025). Per kilogram, protected lettuce usually carries the larger footprint.
Energy. A plant factory needs about 247 kWh of purchased electricity per kilogram of dry lettuce, against about 70 for a Dutch greenhouse (Graamans et al. 2018). Sunlight is free, which is the main reason greenhouses dominate.
Food miles. Transport is about 11 percent of the life-cycle emissions of US food, and final delivery from producer to retailer about 4 percent (Weber and Matthews 2008). Growing near the customer shortens the supply chain, but it does little for the climate.
Staple crops. Electricity alone costs about $10 per kilogram of dry matter in a vertical farm, while staple grains sell for under $1 per kilogram at the farm gate (Lovat, Noor and Milo 2025). Lettuce and tomatoes are about 95 percent water, which is why the math works for them and fails for wheat.
CEA wins where control buys something a field cannot: yield per square meter, water per kilogram and consistency, for perishable, high-value crops.
Why CEA is growing, and what gets grown
The 2024 Census of Horticultural Specialties counted 3,731 US operations growing food crops under protection, up from 2,994 in 2019 and 2,521 in 2014. Sales reached $1.01 billion, up 44 percent from 2019 in nominal terms, or about 17 percent after inflation by our calculation. The area under protection barely moved, at about 90 million square feet in both 2019 and 2024. The growth is in more and smaller operations and in higher value per square foot, not in more acreage.
Lettuce is the growth story. Greenhouse lettuce sales went from $71.1 million in 2019 to $238.3 million in 2024. Tomatoes are still the largest crop at 37.9 percent of 2024 sales, followed by lettuce at 23.6 percent, herbs at 8.6 percent and microgreens at 8.5 percent. Strawberries are the newest arrival, from under $1 million in sales in 2019 to $20.3 million in 2024.
Imports carry much of the market. Greenhouse tomatoes are roughly a third of US fresh-market tomato production, yet “domestic greenhouse output accounts for just 12 percent of available greenhouse tomato supply” (USDA ERS 2024). Canada’s greenhouse fruit and vegetable sales reached CAD $3.1 billion in 2025, up 10 percent, and about 99 percent of its greenhouse exports go to the US (Statistics Canada).
The crop list follows the economics. By our calculation from the 2024 census, microgreens earned about $29.50 in annual sales per square foot under protection, lettuce about $25.20 and tomatoes about $7.50. Short cycles, perishable product and a harvest that is mostly water are what make a crop work under cover. Mushrooms, a separate $1.5 billion category in the same census, are grown indoors and counted on their own.
What “controlled” means in a working facility
A setpoint is a request. Control is what the room did. The variables are familiar: light, temperature, humidity and airflow, CO2, irrigation, nutrients and the root zone. The failures come from the gap between what each one was set to do and what it did, and the crop problems PDS has written about are each one variable doing something nobody saw in time.
- Tipburn is airflow and transpiration starving young leaves of calcium.
- Bolting is cumulative hours above a narrow temperature band.
- Pythium is root-zone water temperature.
- Botrytis is accumulated hours of high humidity.
- Powdery mildew is a humidity band, not a fungicide gap.
- Iron deficiency is pH drifting out of range.
- Blossom end rot is calcium transport in fruiting crops.
None of these is solved by the enclosure. Each is solved by seeing the variable while there is still time to act. PDS is hardware-agnostic by design: it layers on top of the controllers you already run, including TrolMaster, Aroya and Growlink, and its Environmental Analyzer and setpoint-versus-actual alerts show what each room did against what it was set to do.
Five questions to tell control from enclosure
- Do you know the conditions at the canopy, or only what the control sensor reads? One sensor describes one point in a room.
- Can you see how long conditions sat outside their target range, not just whether they left it? Bolting and Botrytis are both driven by how long conditions stay wrong.
- When a crop underperforms, can you trace the loss to the variable that caused it, or does it get written off to the weather or the variety?
- Do your environmental, irrigation and harvest records live in one place, or in three systems and a spreadsheet?
- Do you know which room, crop or cultivar earns the most per square foot? That is the number the whole category runs on.
Real results, not more dashboards. That is the cultivation intelligence question.
Controlled environment agriculture often produces higher yields and better quality, and the researchers who say so chose that word carefully. The enclosure makes control possible. It does not supply it. Greenhouse production keeps growing while the most energy-hungry corner of the category contracted, because the operations that last treat control as something they measure every day. So what is controlled environment agriculture? A degree of control over what decides yield, and only as much of it as you act on.
See what your rooms did. Control what decides yield.
See how PDS connects your environmental, irrigation and harvest data into one cultivation intelligence platform built for operators who want to control what decides yield.
Frequently Asked Questions
What is controlled environment agriculture?
Controlled environment agriculture, or CEA, is crop production in an enclosed structure that gives the grower complete or partial control of growing conditions such as light, temperature, humidity, CO2 and irrigation. USDA’s Economic Research Service also calls it protected agriculture. It covers high tunnels, greenhouses, vertical farms and mushroom houses, and it can use soil, substrate or hydroponics.
Is controlled environment agriculture the same as vertical farming?
No. Vertical farming is one type of CEA, using stacked tiers under artificial light in an insulated building. It is a small part of the category: greenhouses cover roughly 500,000 hectares worldwide outside China, against about 30 hectares of vertical farms. Researchers argue the right comparison for a vertical farm is a high-tech greenhouse, not an open field.
Why is controlled environment agriculture important?
It produces far more per square meter than field growing, uses roughly 85 to 90 percent less water per kilogram of leafy greens in recirculating systems, and smooths supply against weather, drought and field disease. Those gains come with tradeoffs, chiefly higher energy use and, per kilogram, usually a larger carbon footprint than field production.
What crops are grown in controlled environment agriculture?
In the US, tomatoes and lettuce lead by sales, followed by herbs and microgreens, with cucumbers, peppers and strawberries also grown. The common thread is a short cycle, a perishable product and a high value per square foot. Staple grains do not work under cover, because the electricity alone costs more than the crop sells for.
Does controlled environment agriculture use less water than field farming?
Yes, per kilogram of produce. Pooled lettuce data put the median open-field crop at about 104 liters per kilogram, against about 15 in high-tech greenhouses and 16.5 in vertical farms. The often-quoted 95 percent saving is a best case, and recirculating greenhouses achieve most of the saving that vertical farms claim.
- Heuvelink, E., Hemming, S. & Marcelis, L.F.M. (2025). “Some recent developments in controlled-environment agriculture: on plant physiology, sustainability, and autonomous control.” Journal of Horticultural Science and Biotechnology 100(5):604 to 614. doi.org/10.1080/14620316.2024.2440592
- Stanghellini, C. & Katzin, D. (2024). “The dark side of lighting: A critical analysis of vertical farms’ environmental impact.” Journal of Cleaner Production 458:142359. doi.org/10.1016/j.jclepro.2024.142359
- Pennisi, G., Gianquinto, G., Marcelis, L.F.M., Martin, M. & Orsini, F. (2025). “Vertical farming: productivity, environmental impact, and resource use. A review.” Agronomy for Sustainable Development 45:57. doi.org/10.1007/s13593-025-01055-w
- Graamans, L., Baeza, E., van den Dobbelsteen, A., Tsafaras, I. & Stanghellini, C. (2018). “Plant factories versus greenhouses: Comparison of resource use efficiency.” Agricultural Systems 160:31 to 43. doi.org/10.1016/j.agsy.2017.11.003
- Lovat, S.J., Noor, E. & Milo, R. (2025). “Vertical farming limitations and potential demonstrated by back-of-the-envelope calculations.” Plant Physiology 198(3):kiaf056. doi.org/10.1093/plphys/kiaf056
- Weber, C.L. & Matthews, H.S. (2008). “Food-Miles and the Relative Climate Impacts of Food Choices in the United States.” Environmental Science and Technology 42(10):3508 to 3513. doi.org/10.1021/es702969f
- Marshall, K.E. et al. (2020). “Lessons Learned from a Decade of Investigations of Shiga Toxin-Producing Escherichia coli Outbreaks Linked to Leafy Greens, United States and Canada.” Emerging Infectious Diseases 26(10):2319 to 2328. doi.org/10.3201/eid2610.191418
- Topalcengiz, Z., Chandran, S. & Gibson, K.E. (2024). “A comprehensive examination of microbial hazards and risks during indoor soilless leafy green production.” International Journal of Food Microbiology 411:110546. doi.org/10.1016/j.ijfoodmicro.2023.110546
- Janick, J. & Paris, H.S. (2022). “History of Controlled Environment Horticulture: Ancient Origins.” HortScience 57(2):236 to 238. doi.org/10.21273/HORTSCI16169-21
- Wheeler, R.M. (2017). “Agriculture for Space: People and Places Paving the Way.” Open Agriculture 2(1):14 to 32. doi.org/10.1515/opag-2017-0002
- USDA National Agricultural Statistics Service (2026). 2024 Census of Horticultural Specialties, Table 15, Food Crops Grown Under Protection; and the 2019 and 2014 editions. nass.usda.gov
- Dohlman, E., Maguire, K., Davis, W.V., Husby, M., Bovay, J., Weber, C. & Lee, Y. (2024). Trends, Insights, and Future Prospects for Production in Controlled Environment Agriculture and Agrivoltaics Systems. USDA Economic Research Service, EIB-264. ers.usda.gov
- USDA Economic Research Service (2024). Vegetables and Pulses Outlook, VGS-372, April 2024. ers.usda.gov
- USDA National Agricultural Statistics Service (2023). Vegetables 2022 Summary. February 2023.
- Lewis Ivey, M., Rivas, A., Kubota, C. et al. (2025). “What Is Controlled Environment Agriculture (CEA)?” Ohio State University Extension, HYG-5819. cfaes.osu.edu
- Cornell University Controlled Environment Agriculture program. “About CEA.” cea.cals.cornell.edu
- USDA Risk Management Agency (2026). “Controlled Environment” frequently asked questions. rma.usda.gov
- Doss, South, Lowman & Evans (2026). Virginia Cooperative Extension, SPES-751NP. pubs.ext.vt.edu
- Statistics Canada (2026). The Daily, April 22, 2026 (greenhouse data, Table 32-10-0023-01). statcan.gc.ca
Comments are closed